Page tree

In this discussion we will go into a little bit deeper on the Monitor Archive Storage dashboard.


HOW TO USE:

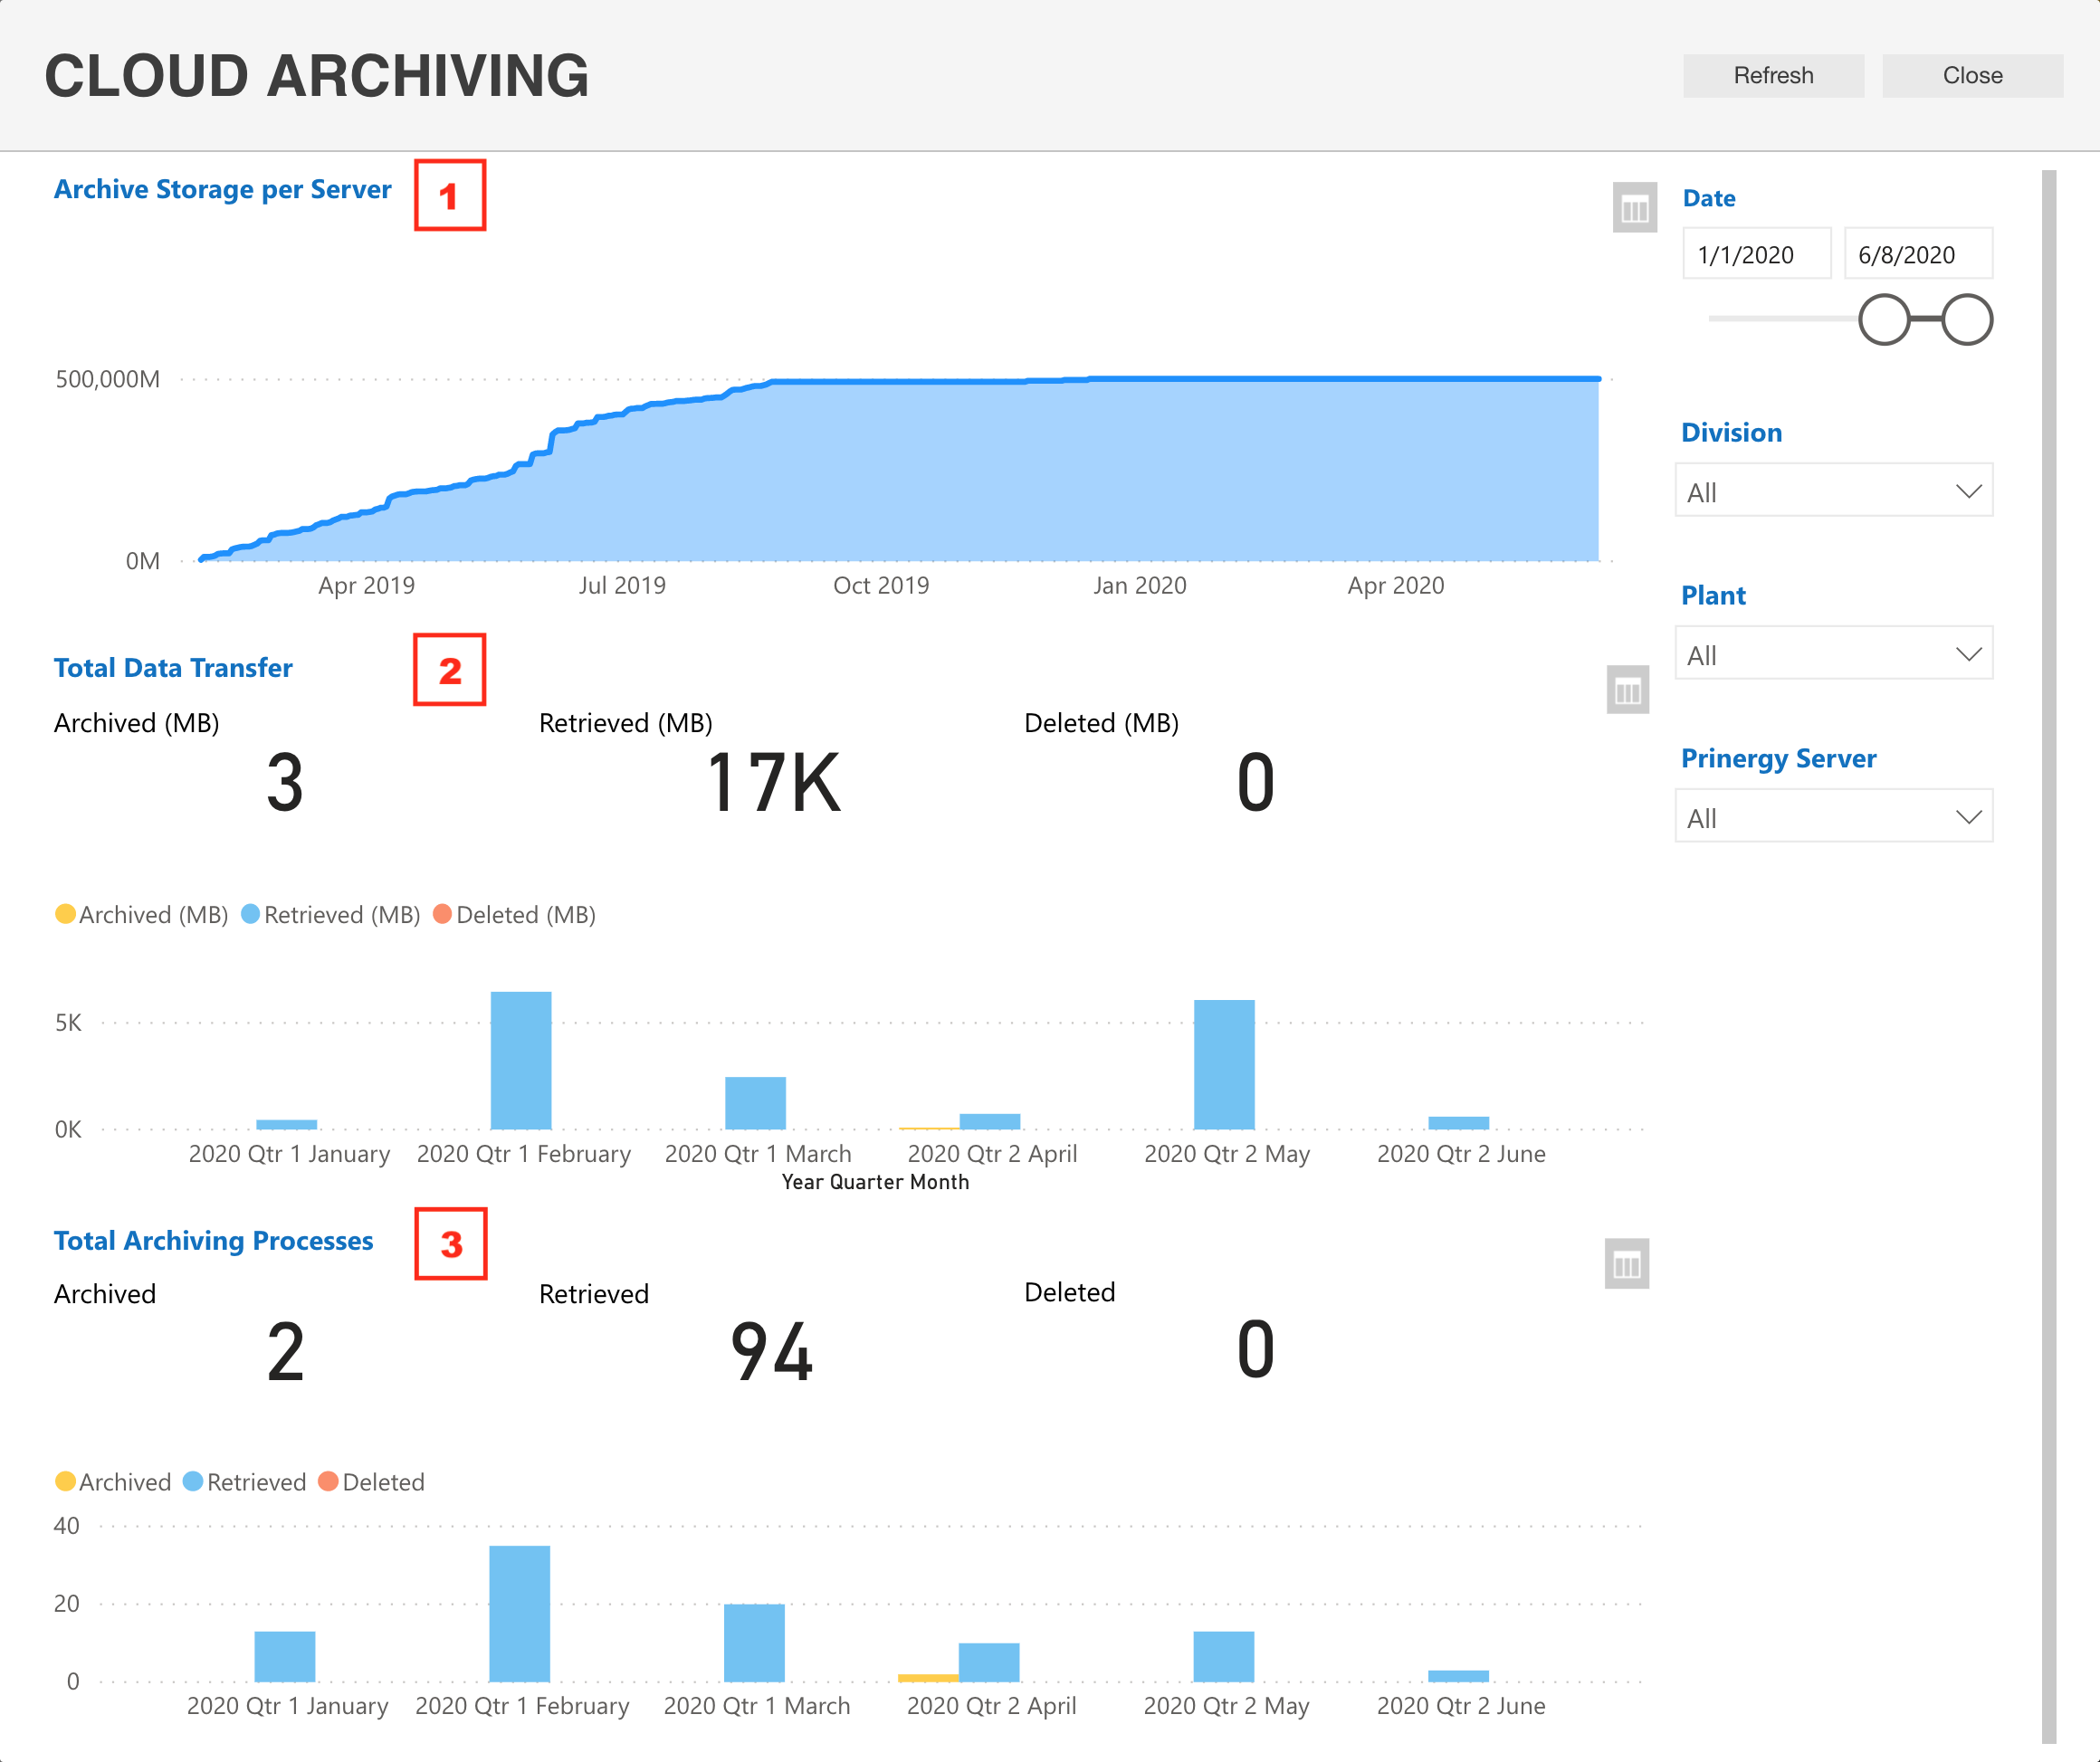
Using the Filter options pane on the right to adjust to the Date, Division, Plant and/or PRINERGY server you want to review.

Click on the <Refresh> to take new Filter adjustments into account. Click on <Close> to take you back to the <Services>.


NOTE: The information on this dashboard is updated daily


UNDERSTANDING THE DASHBOARDS:

Number

Name of report/chart

Description

1

Archive Storage per Server 

Provides visual information in a Horizontal Time Series Chart about the total amount of storage contained within the PRINERGY Cloud Archive.

  • X-axis represents the given time period defined in the Filters on the right.
  • Y-axis represents the amount of storage space is used by your archived jobs (in MB).

Options included with this view:

2

Total Data Transfer 

This view comes in two parts:

  • Top section breaks down Archived, Retrieved and Deleted amounts in MB, that have taken place over the given time period defined.
  • Bottom section provides visual information in a Vertical Time Chart about the volume of data transferred to the PRINERGY Cloud Archive service (MB).

Details include a representation of the amount of data for that has been:

  • Archived - Shown as a Yellow bar - this highlights any Archive process manual or automatic that has occurred in the given time period defined in the Filter on the right. Click on the bar to have the Top Section numbers adjust to the spotlight selection.
  • Retrieved - Shown as a Blue bar - this highlights any Retrieve process that has occurred in the given time period defined in the Filter on the right. Click on the bar to have the Top Section numbers adjust to the spotlight selection.
  • Deleted - Shown as an Orange bar - this highlights any Delete process manual or automatic that has occurred in the given time period defined in the Filter on the right. Click on the bar to have the Top Section numbers adjust to the spotlight selection.

Options included with this view:

  • Focus to enlarge to full screen
  • Switch to Table - to show all the information contain within the chart
  • Spotlight to highlight the item you have selected

3

Total Archiving Processes

This view comes in two parts:

  • Top section breaks down Archived, Retrieved and Deleted events that have taken place over the given time period defined.
  • Bottom section, provides visual information in a Vertical Time Chart breaking down the Archived, Retrieved and Deleted events.

Details include a representation of the amount of data for that has been:

  • Archived - Shown as a Yellow bar - this highlights any Archive process manual or automatic that has occurred in the given time period defined in the Filter on the right.
  • Retrieved - Shown as a Blue bar - this highlights any manual Retrieve process that has occurred in the given time period defined in the Filter on the right.
  • Deleted - Shown as an Orange bar - this highlights any Delete process manual or automatic that has occurred in the given time period defined in the Filter on the right.

Options included with this view:

  • Focus to enlarge to full screen
  • Switch to Table - to show all the information contain within the chart
  • Spotlight to highlight the item you have selected

Special Considerations:

An archived job can be displayed in the Deleted report:

  • When you destroy a job on Prinergy, its archived files are deleted from the cloud.
  • When you archive a job for the second time, or when some of a job files are already archived, the previous archived job is deleted.


  • No labels