- Click the desired color channel.
- Do the following:
- To view tint out values in the graph and table, click the Tint Out icon
 .
. - To view tint change values (Tint Out minus Tint In) in the graph and table, click the Tint Change icon
 .
.
- To view tint out values in the graph and table, click the Tint Out icon
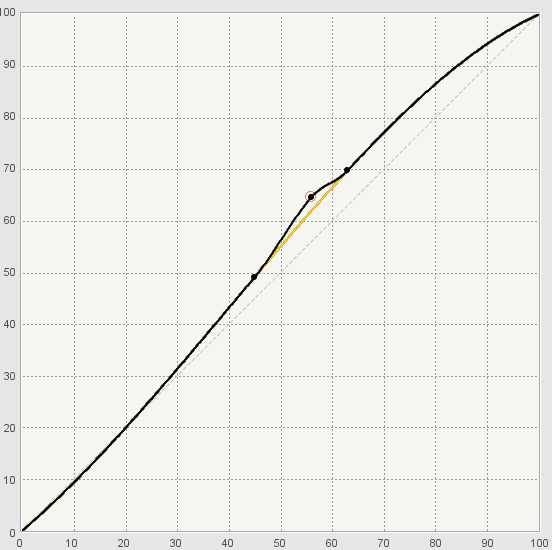
- You can also click a point that you want to adjust and then click two anchor points on either side of the point to constrain a range of your adjustment. The curve will not be affected at tint values outside of these anchor points.
Overview
Content Tools