In this discussion we explore the Server Metrics dashboard. This view contains three subsections, CPU, Memory and Disk.
Use this dashboard to take a glance at how well your Prinergy system(s) are performing. By adjusting the Filter pane between Dates ranges, Division(s), Plants and individual Prinergy systems you can capture a snapshot, say BEFORE and AFTER a system upgrade.
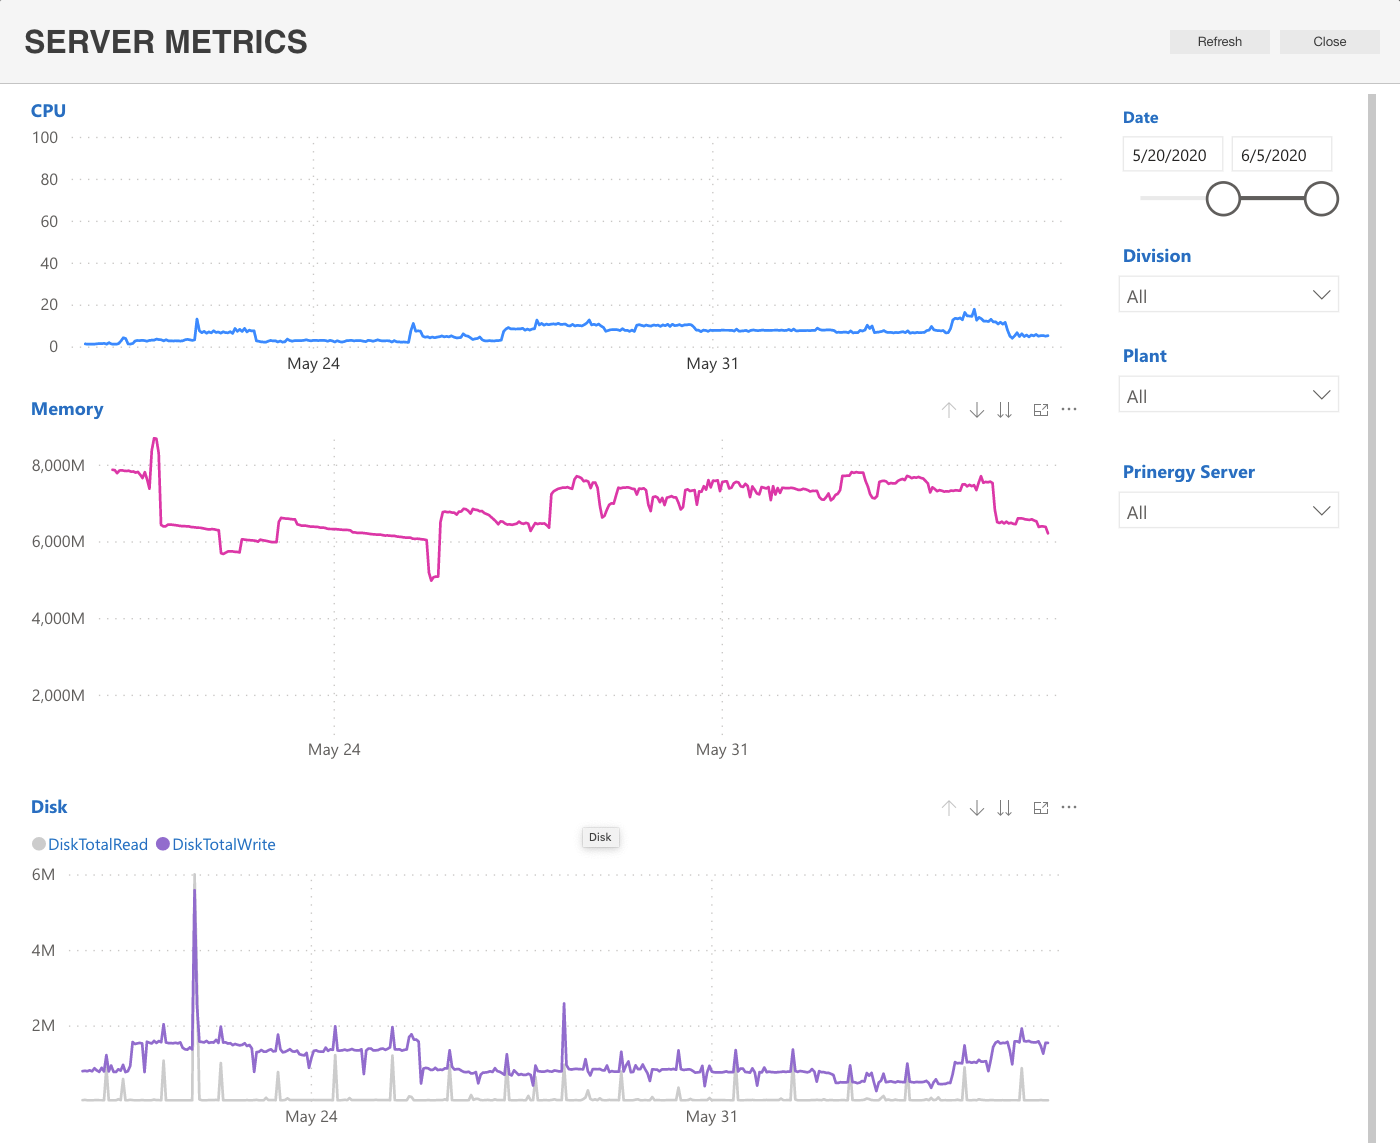
NOTE: some of these dashboards may appear to be in excess of the stated unit of measure, such as Memory. This situation could develop as the Operating System, caches or uses Disk memory; this is normal, and not entirely indicative of an issue.