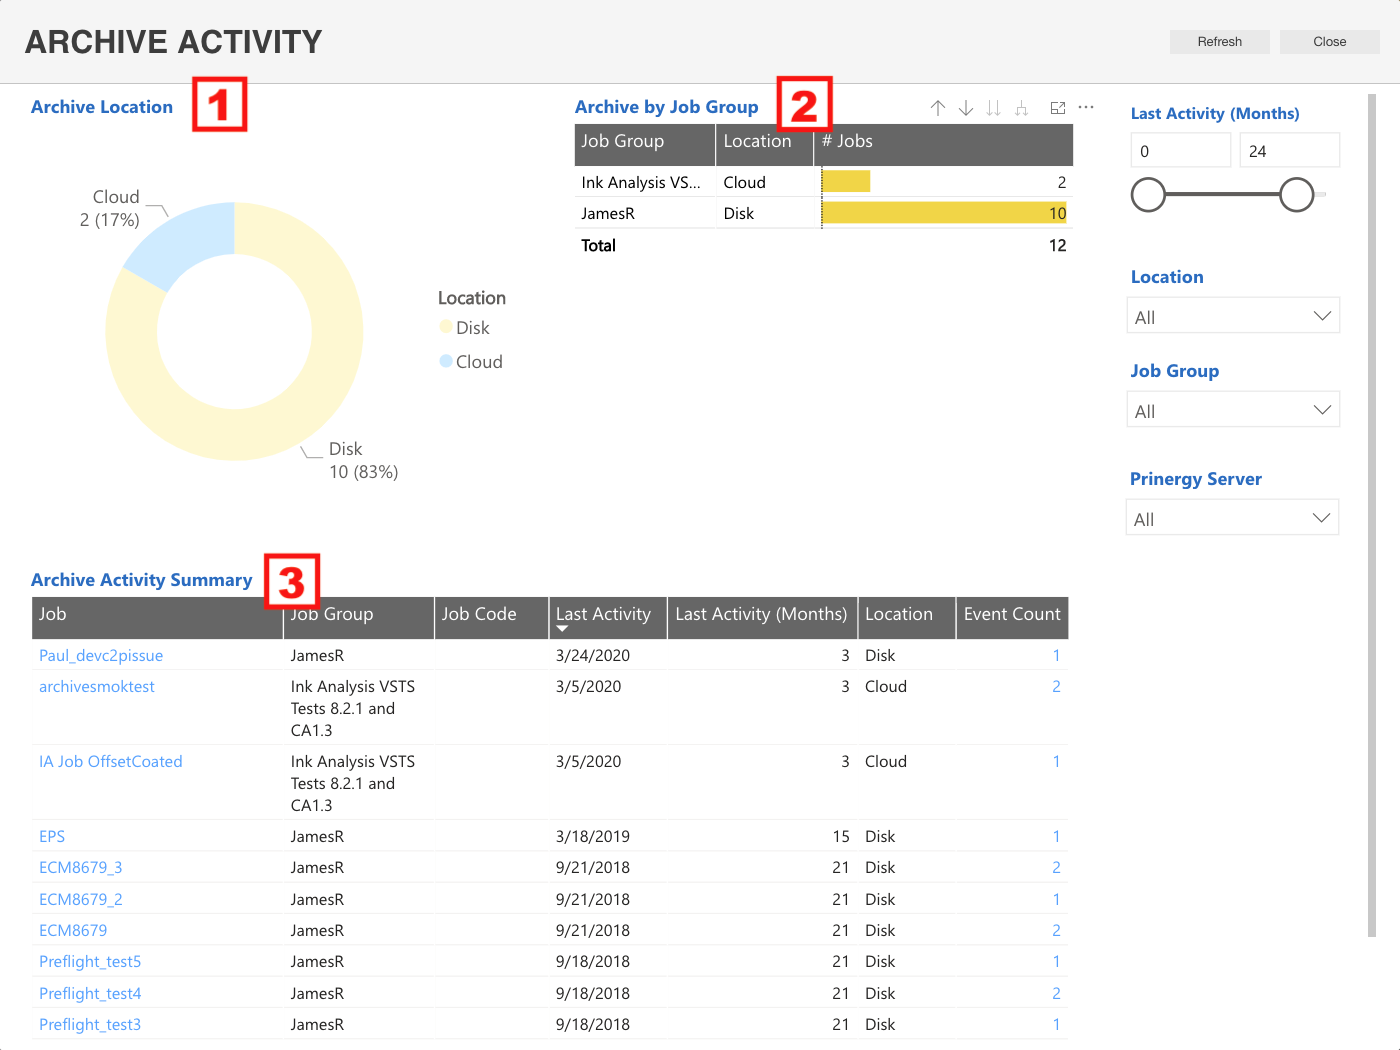
In this discussion we will go into a little bit deeper on the Monitor Archive Activity dashboard.
HOW TO USE:
Using the Filter options pane on the right to adjust to the Date, Division, Plant and/or PRINERGY server you want to review.
Click on <Refresh> to take new Filter adjustments into account. Click on <Close> to take you back to the <Services>.
NOTE: The information on this dashboard is updated daily
UNDERSTANDING THE DASHBOARDS:
Number | Name of report/chart | Description |
|---|---|---|
1 | Archive Location | Provides visual information in a Vertical Time Series Chart about the number of jobs that are Archived on the PRINERGY Cloud relative to the number of jobs that are Archived on the disk (server).
Options included with this view:
|
2 | Archive by Job Group | This table displays the number of jobs that are Archived on PRINERGY Cloud and the numbers of jobs that are Archived on the disk for each job group. Details included within the table (left to right) are:
Options included with this view:
|
3 | Archive Activity Summary | Provides specific job information about the job's Archive location (Disk or Cloud) and the recent activity date of the job. This report enables you to identify if the job is active or if it is outdated and can be deleted. Details included within the table (left to right) are:
Options included with this view:
|
Special Considerations:
Beyond the normal Filter options you can also:
- Sort based on Activity passed on past months.
- Sort by Job Group
