You will run a job through a Prinergy Evo workflow and produce five sets of Virtual Proofing System files. You will then use the Virtual Proofing System Densitometer tool to see how calibration curves have been applied to output.
To have a consistent and easily measured target, this job will use the Kodak Plate Control Strip (KPCS) both as page content and as a mark.
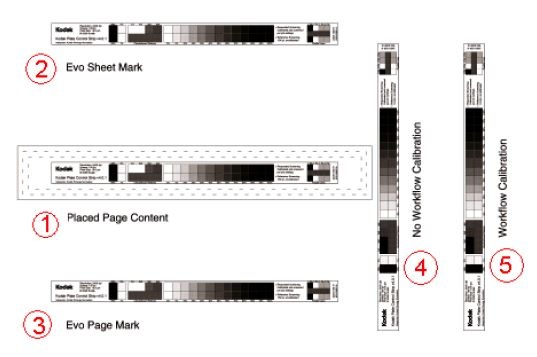
- Placed Page Content: The KPCS was placed in a run list in Preps as if it were a page to be printed.
- Evo Sheet Mark: The KPCS was placed in Prinergy Evo using the Sheet Mark option in an Output from Imposition process template.
- Evo Page Mark: The KPCS was placed in Prinergy Evo using the Page Mark option in an Output from Imposition process template.
- No Workflow Calibration: The KPCS was placed in a Preps template as a Smart Mark and flagged to not have workflow calibration applied to it.
- Workflow Calibration: The KPCS was placed in a Preps template as a Smart Mark and flagged in Preps to have workflow calibration applied to it.
In this exercise, it is important to be able to determine whether the plate and print curves have been applied correctly. The job uses two curves that make it easy to distinguish which curve or curves have been applied to each control strip. Each of these curves is a linear cutback curve where every output value is multiplied by the same value. This is not intended to represent real-world plate or print curves.
This image represents the Harmony curve named Plotter Proof 80%. This curve is used as the print curve in the exercise job. It cuts back every tint to 80% of its nominal value. The red line represents a nominal 50% tint. The green line illustrates that it will be output at 40% (0.80 x 0.50).
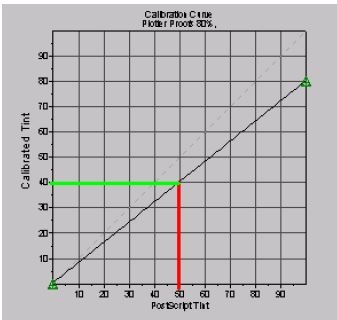
The plate curve used is a linear cutback to 60% of the nominal value. In that case, 50% will be output as 30% (0.60 x 0.50).
Prinergy Evo applies the two curves by multiplying them together. For example, if you apply both of the above curves to a nominal 50% output, it will actually be output as 24% (0.60 x 0.80 x 0.50). In the exercise, you will find that the 50% swatches on the control strip output at 50%, 40%, 30% or 24% depending on the combination of curves applied in the particular example and which curves are applied to that specific control strip.
To determine the actual output values, you will use the Densitometer tool in Kodak Virtual Proofing System 3.0 (or later).
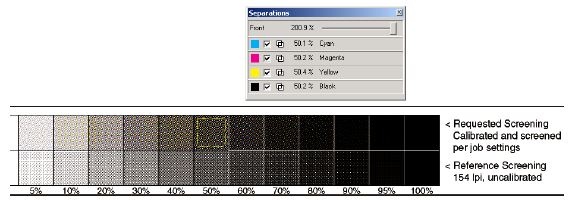
In the toolbar, the Densitometer tool looks like an eyedropper. You will use it to select the area you want to measure as shown by the yellow square above. If you include parts of multiple swatches, the Densitometer tool will calculate the overall tint within the selection. For this exercise, be sure that your entire selection is inside the upper 50% swatch on each control strip. The descriptions in the exercise tell you what values to expect for the 50% tint patch on each control strip.