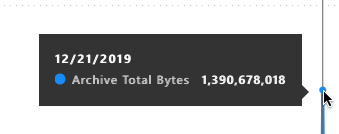
With the Time Series Charts, you also have the ability to select a point in time and the tool tip will report relevant data.
As shown for Cloud Archiving
NOTE: This chart was captured by using the Focus feature to enlarge to the maximum size.
Simply take your mouse, drag to the point in time on the chart, and in a few seconds the tool tip will update with the data point.
In this example:
The clicked on point in time, shows that on 12/21/2019, the Archive had captured 1.39MBs

Back to the top of the page.