The real-time debugging functionality in Rule Debugger enables you to test a rule set by setting breakpoints—points at which the rule set will pause when executing and wait for further instruction before proceeding. This enables you to control the execution of a rule set so that you can more easily identify any points in the rule set that are not working properly.
To perform real-time debugging on a rule set, open the rule set in Rule Debugger by selecting the rule set in Rule Set Manager and then selecting File > Debug or clicking Debug  .
.
You can perform real-time debugging on an enabled rule set as long as you debug the rule set in context; rule sets enabled at the system level must be debugged in system context while rule sets enabled for specific jobs only must be debugged in job context.
Initially the rule set appears in Rule Debugger along with any information about the rule set's execution history.
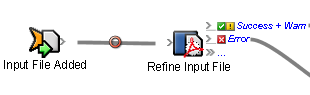
You can then set breakpoints on the rule set. You can set breakpoints manually or automatically. When you set breakpoints manually, you specify the points at which the execution of the rule set will pause. When you set breakpoints automatically, a pause is automatically initiated before the first action after the trigger event. (Note that the pause icon will not actually appear on the rule set in Rule Debugger until the next execution of the rule set.) If the rule set includes any flow control actions (timer, split, or repeat actions), breakpoints are also placed before each one. After the rule set execution automatically pauses before the first action, you can also manually add breakpoints to the rule set.
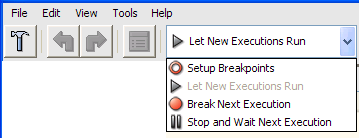
Use the list near the top of the Rule Debugger window (or the File > Set Mode menu items) to specify how you want to set breakpoints on the rule set.
Select this option | To take this action |
|---|---|
Setup Breakpoints | Manually set breakpoints on the rule set.
|
Stop and Wait Next Execution | Automatically pause the next execution of the rule set before the first action after the trigger event, and add breakpoints before any flow control actions (timer, split, and repeat actions) in the rule set. |
Break Next Execution | Run the next execution of the rule set with breakpoints enabled. |
Let New Executions Run | Run the next execution of the rule set without stopping at any breakpoints. |
Once you have set breakpoints on the rule set, select Break Next Execution or Let New Executions Run. The execution history panes reappear in Rule Debugger so that you can view information about the next execution of the rule set.
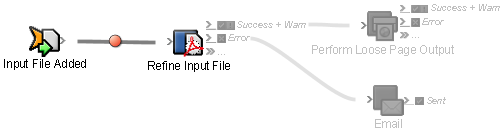
When you select Break Next Execution, the next execution of the rule set will run with breakpoints enabled. When the execution of the rule set pauses at a breakpoint, the breakpoint icon changes from ![]() to
to ![]() to indicate where the execution is paused.
to indicate where the execution is paused.
You can now use the features of Rule Debugger to analyze the execution of each action in the rule set and determine any points at which the rule set might be encountering problems. The buttons that appear near the top of the window enable you to control any further execution of this instance of the rule set so that you can analyze the evaluated data for each event/action pair as the action occurs.
Click this button | To take this action |
|---|---|
Pause | Stop this execution of the rule set before the next action. If the current action is a timer, pause immediately. |
Go | Continue the execution of the rule set as far as possible—either to the next breakpoint or to the end of the rule set. |
Step All | Allow the rule set to proceed to the next action only. |
Stop Debugging and Continue Processing | Release all breakpoints and complete the execution of the rule set. |
Stop Debugging and Abort Processing | Stop the execution of the rule set and abort any further actions in this rule set instance. |
When you determine why a rule set is encountering problems, you can fix the rule set following the instructions in Fixing rule set problems.