In this discussion we will explore the Separations dashboard.
In the Separations dashboard, you can view the following reports:
Number | Name of report/chart | Description |
|---|---|---|
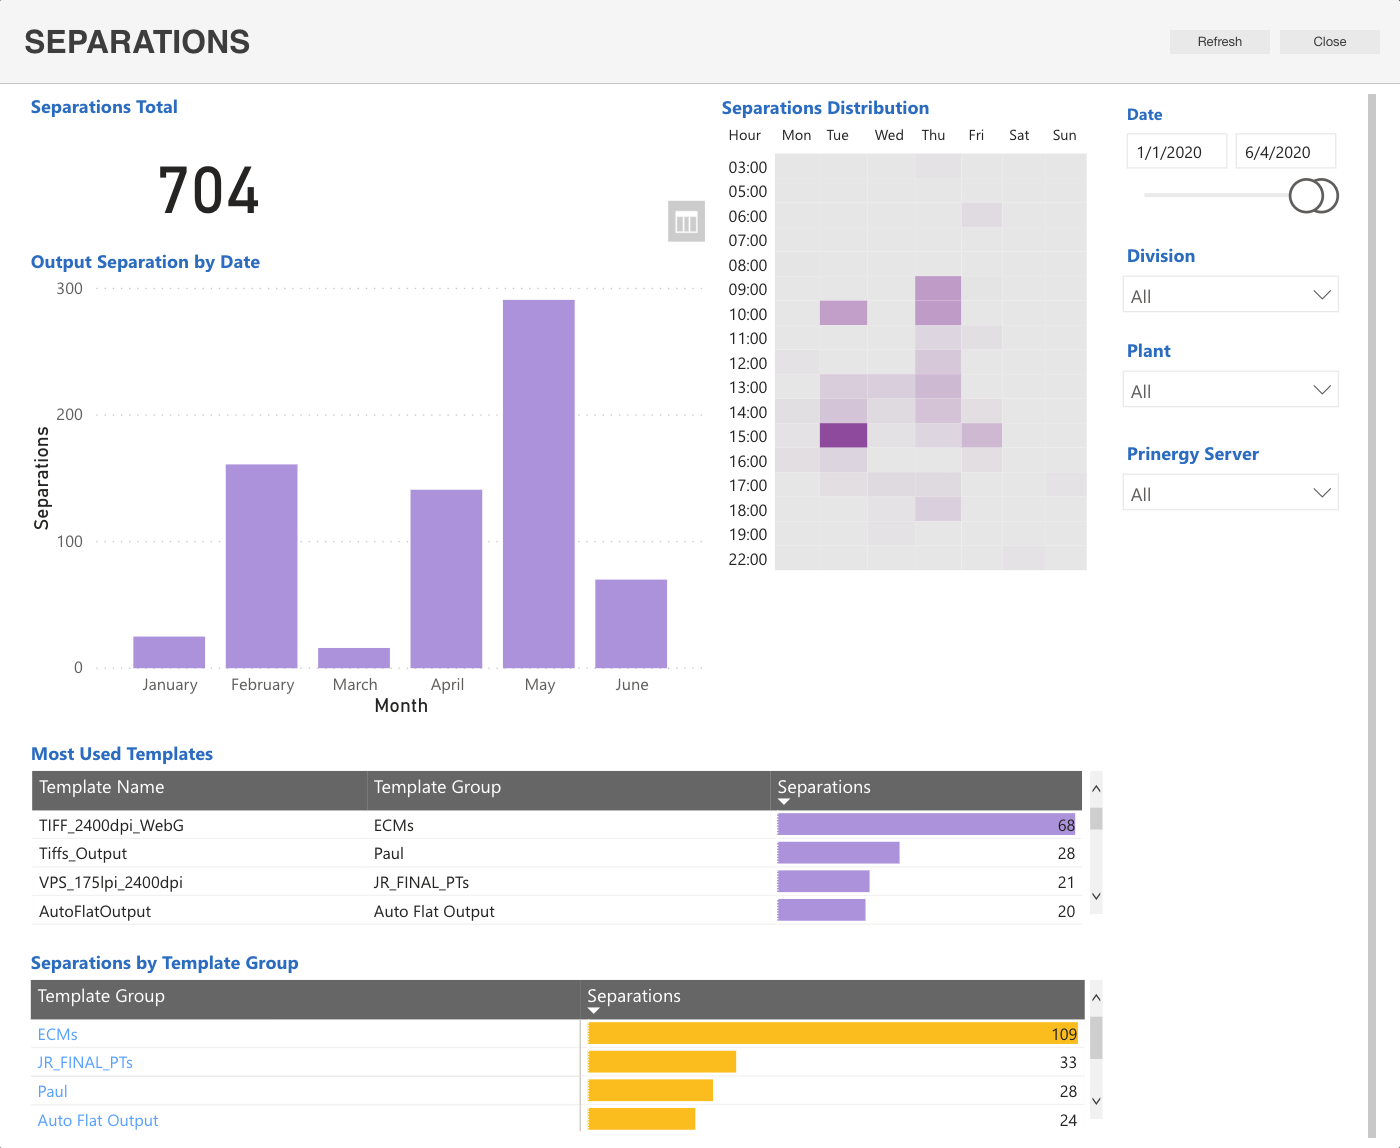
| 1 | Output Separation by Date | Displays the number of separations that were created (usually this information is equivalent to the number of plates that were used). |
| 2 | Most Used Templates | Displays the 10 most used process templates in a descending order. |
| 3 | Separations by Template Group | Displays the number of separations that were produced by a specific process template group. Note: You can drill down into the details of a template group by clicking its name. The report will show the number of separations that were produced by each template in a specific group. |
| 4 | Separations Distribution | Displays the number of the separations that were produced in a specific hour, relative to other times in the same day of the week. The darker areas indicate that a larger number of separations were produced at that time. |