Navigate to this dashboard by clicking on the Page Activity tab in the common overview dashboard.
How to Use
Using the Filter options pane to the right to adjust the date range and press(es) which you want, as with the Press Availability dashboard.
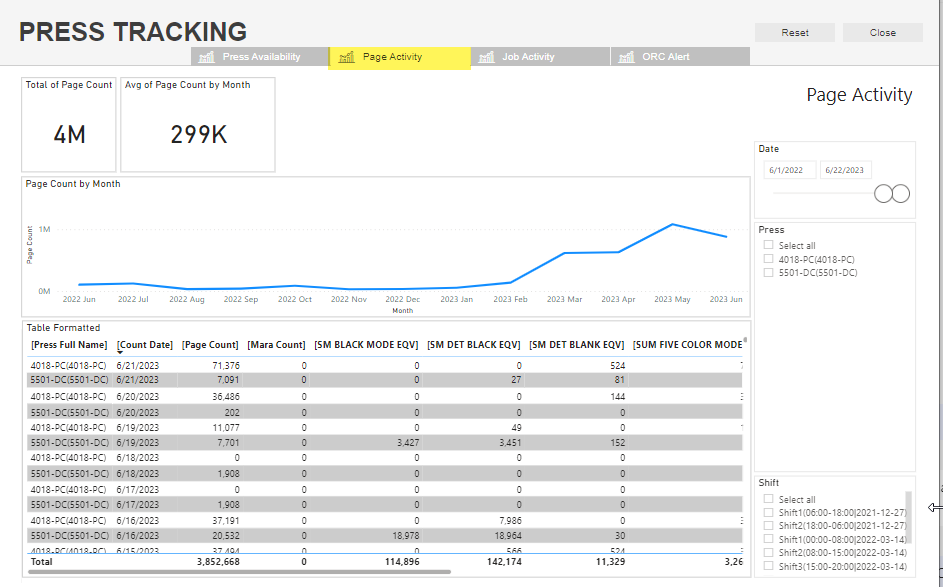
The Page Activity dashboard provides insight into the A4 page equivalent count running through the NexPress press or presses which have been selected by the filter on the right.
- “Total Of Page Count” number provides the total page count for the entire date range selected, as a cumulative total.
- “Avg of Page Count By Month” provides the arithmetic mean of the page count total for each month during the selected date range, averaged across the entire selected date range.
- “Page Count by Month” graph provides the time trace of the page activity count. By examining this graph for each individual press or group of presses, it is possible to obtain insights to improve load balancing and productivity across the presses, generally by observing if there is an imbalance of page activity on a subset of the presses.
The details table below the Page Count by Month graph provides additional details driven by NexStation DFE data, showing the breakdown (for example) of black-and-white vs. 4-color pages which have been printed.