Do the following:
- To view tint out values in the graph and table, click the Tint Out icon
 .
. - To view tint change values (Tint Out minus Tint In) in the graph and table, click the Tint Change icon
 .
.
- To view tint out values in the graph and table, click the Tint Out icon
- Move the sliders below the graph to constrain the range of your adjustment and to select the center of your adjustment.
 The curve will not be affected at tint values outside of this range. There are implied anchor points at 0% and 100%.
 -
The color patch displays the output color. If the displayed color does not visually align to the color on your proof or press sheet, you can adjust the displayed color in the color patch:
- To reset the display to the default displayed color, click the Reset icon
 .
.
- To reset the display to the default displayed color, click the Reset icon
- The displayed color patch demonstrates the effect of your adjustments.
The color produced before your adjustment is shown on the left. Your adjustment is shown on the right.

- To display the color patch in a larger view for easier color comparison, click anywhere in the color patch.
- Adjust color cast, lightness, or both by the following:
- Use the lightness (L*) slider
 to make the color darker or lighter. You can also enter the L* value directly in the Color Change columns.
 - Use the cast (a*b*) selector
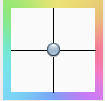 to adjust the color cast. You can also enter the a*, b* values directly in the Color Change columns.
Overview
Content Tools