ColorFlow window The ColorFlow window consists of four major tabs: ColorFlow icons The color and animation of an icon indicate the processing state of the element that is associated with it: Icon Function Properties Opens a dialog box in which you can specify condition properties to define a device condition Profile Opens a dialog box in which you can manage the profile of a device condition or PCO Curves Opens a dialog box in which you can define or adjust calibration curves or device curves for curve-controlled devices Measurements Opens a dialog box in which you can create a chart, measure a printed chart, import measurement data, and generate a report Simulation Opens a dialog box in which you can define or adjust how the PCO simulates a target Conversion Opens a dialog box in which you can define or adjust how the SCO is calibrated to align to the PCO color space or define how CI data is modified for the PCO color space Icon color and animation The color and animation of each icon indicate the processing state of the element that is associated with the icon: Color or animation Icon examples Processing state Orange Not complete. Define this element before all other elements Black, white, or gray Not complete. This element cannot be defined until the calculation for another element is completed Spinning Queued, waiting to calculate. Slow sweep Calculating. The green portion of the icon indicates the amount of calculation that is complete Solid green Complete
The viewer window on the right shows the transfer curve object, or the print calibration curve object (with the target on the top and the device at the bottom). You can create, view, and manage all the print curves in this tab.


Opens a dialog box in which you can generate a Verification report
ColorFlow processes are interdependent. You must perform tasks in a specific order. The ColorFlow interface guides you through the completion of tasks using a graphic indication of what needs to be defined next, what is currently being calculated, and what has completed calculation. 


Note: Do not redefine a queued element


Single border 
Single input/output version Double border 

Multiple input/output versions
When all elements in a device condition or PCO have been created, the border around the device condition or PCO changes from orange to green.
The following example shows a completed device condition in an incomplete PCO.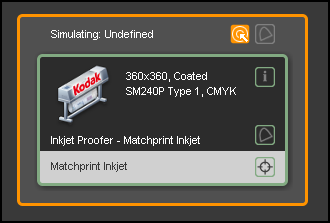
Verification
Overview
Content Tools