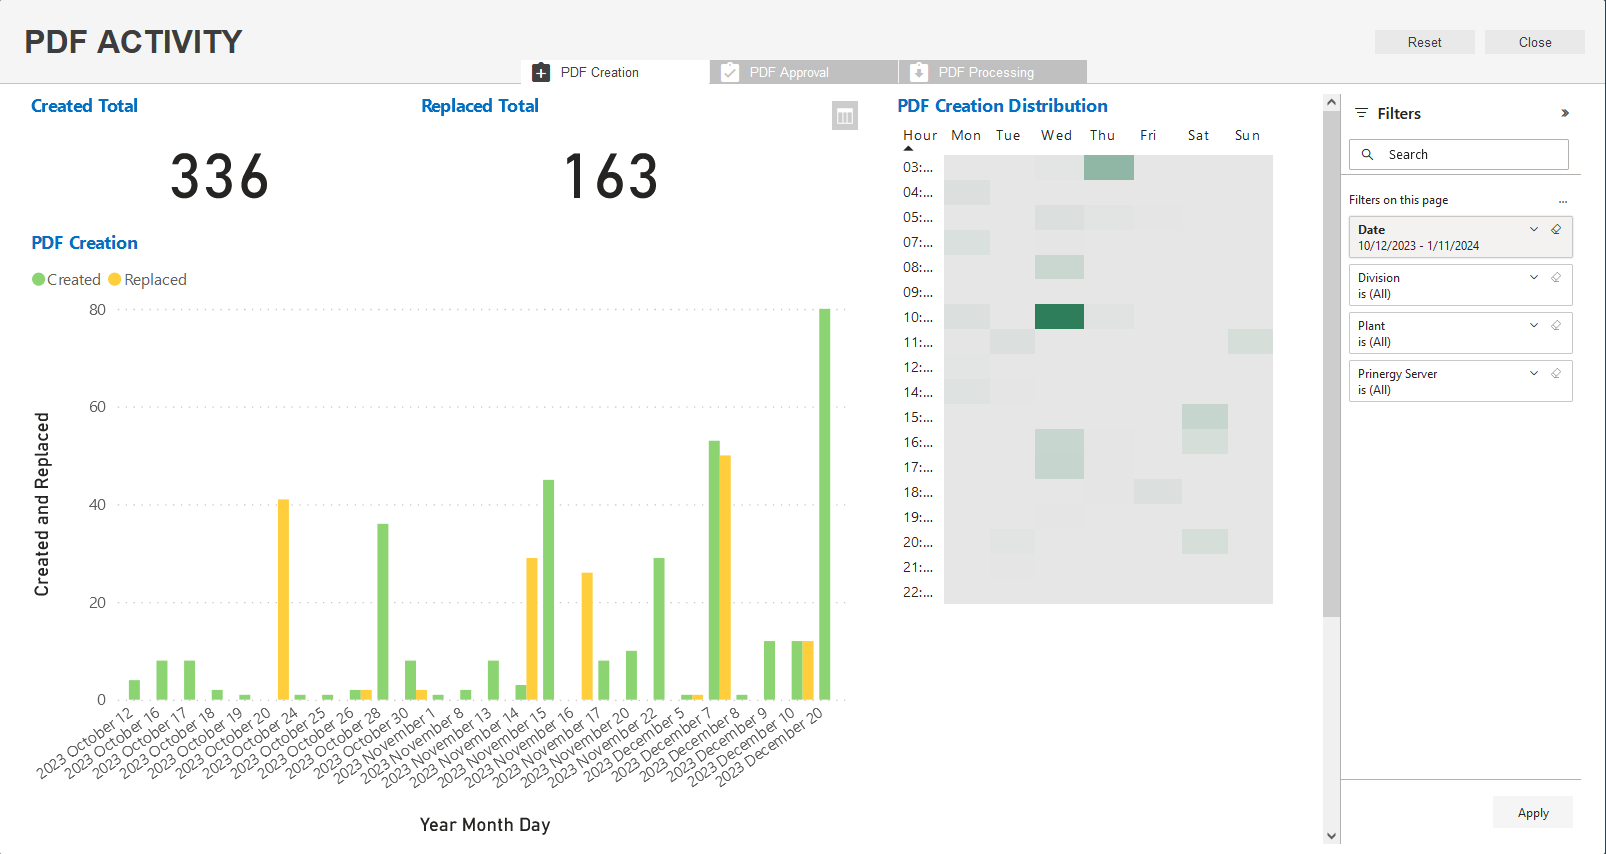
The PDF Creation dashboard displays the total number of PDFs created in a given time period, and how many original PDFs have been replaced.
Created Total represents the number of original pages that were created.
If an original page is refined again with the same Process Template, or Refined with a different Process Template, the Replaced Total number will be incremented, but Created Total will remain unchanged.
On the PDF Dashboard, you can view the following reports and chart:
Number | Name of report/chart | Description |
|---|---|---|
| 1 | PDF Creation | Provides information about the number of pages that were refined and the number of pages that were replaced in a specific period of time. Note: Click the title of a subsection (Created, Replaced) to switch between them. Note: When filtering by week, month, or year, the report will display data from the first day of that period. For example, if you select Year, the displayed data is from Jan/01/2017. |
| 2 | PDF Creation Distribution | Displays the volume of the pages that were refined in a specific hour, relative to other times in the same day of the week. The darker areas indicate a larger number of refined pages. |
